I have finally got around to doing some work on NHL data.
A couple of days ago, Sean Tierney ( ChartingHockey on Twitter ) posted this:
I've published a viz to look at individual player shot types (and results) over time.
— Sean Tierney (@ChartingHockey) August 18, 2018
Have a look and download views here: https://t.co/VplT8byTP8 pic.twitter.com/Gud7oEEOLz
Sean does many great things with Tableau (see more here) so of course I was super excited to see these new charts.
The data comes from Moneypuck and shows shots for NHL seasons 2007-2017. The dataset can be downloaded from Moneypuck - there’s over 1 million shots in the full dataset, however, so keep that in mind!
Looking at Sean’s charts, I chose a few players off the top of my head and one thing I noticed was a distinct difference in shot types between defensemen and forwards. This isn’t revolutionary - you can see it when you watch a hockey game - but it was interesting to see it in the data.
these are super interesting - you can pretty clearly see the difference in slapshot usage between forwards and defense. https://t.co/ODZGQu6JZ9
— em. (@anyembutme) August 18, 2018
I have been meaning to do some analysis on hockey data for ages - but have never quite got properly around to it. But here I thought I might be able to do something relatively straightforward and see if I could cluster players based on their shot types. This is the first bit of work I have done on hockey data (my real-life work deals with health data) so I wanted to do something simple to start with, but which might lead to something more interesting. I had a (very) quick search but couldn’t immediately see that anyone had done this with this dataset - but please do point me towards any similar analyses!
So:
can you cluster by shot types?
does it get any more interesting than 2 clusters of forwards and defensemen?
what other ways could you cluster players?
Data wrangling:
I started by filtering the data to just include the 2015-2017 seasons - even so there are still about 340,000 shots - plenty to start with.
| shooterName | shotID | shotType |
|---|---|---|
| Brad Boyes | 833715 | WRIST |
| Nazem Kadri | 833716 | SNAP |
| Nazem Kadri | 833717 | SNAP |
| Daniel Winnik | 833718 | WRIST |
| Scott Harrington | 833719 | SNAP |
| Joffrey Lupul | 833720 | TIP |
| Dion Phaneuf | 833721 | WRIST |
| Max Pacioretty | 833722 | WRIST |
| Alexander Semin | 833723 | SLAP |
| Jeff Petry | 833724 | WRIST |
I also picked a couple of variables as descriptors - team and position for each skater.
| shooterName | teamCode | playerPositionThatDidEvent |
|---|---|---|
| Brad Boyes | TOR | R |
| Nazem Kadri | TOR | C |
| Daniel Winnik | TOR | C |
| Scott Harrington | TOR | D |
| Joffrey Lupul | TOR | R |
| Dion Phaneuf | TOR | D |
| Max Pacioretty | MTL | L |
| Alexander Semin | MTL | R |
| Jeff Petry | MTL | D |
| Dale Weise | MTL | R |
The first time I tried to cluster shot types, I used totals of each shot type per player. However, this ended up clustering into players who had lots of shots and players who had very few shots - which is not very interesting or useful.
So I took the total of each shot type as a proportion of total shots taken by that player. When I then tried to cluster, It still clustered those with very few shots all in one group, because their relative percentages across all shot types were high. Therefore, I decided to remove anyone who took less than 30 shots - this was the bottom 25% of players in this dataset. I am inclined to set this threshold much higher and see how the results differ - but for now let’s stick with this.
| shooterName | defl | back | wrist | slap | snap | tip | wrap | tot |
|---|---|---|---|---|---|---|---|---|
| Aaron Ekblad | 0.0 | 0.0 | 0.4 | 0.6 | 0 | 0 | 0 | 694 |
| Adam Clendening | 0.0 | 0.0 | 0.6 | 0.3 | 0 | 0 | 0 | 94 |
| Adam Cracknell | 0.0 | 0.2 | 0.7 | 0.1 | 0 | 0 | 0 | 178 |
| Adam Erne | 0.0 | 0.2 | 0.6 | 0.1 | 0 | 0 | 0 | 85 |
| Adam Henrique | 0.0 | 0.3 | 0.6 | 0.1 | 0 | 0 | 0 | 351 |
| Adam Larsson | 0.0 | 0.0 | 0.6 | 0.4 | 0 | 0 | 0 | 316 |
| Adam Lowry | 0.1 | 0.1 | 0.7 | 0.0 | 0 | 0 | 0 | 303 |
| Adam McQuaid | 0.0 | 0.0 | 0.5 | 0.4 | 0 | 0 | 0 | 187 |
| Adam Pelech | 0.0 | 0.0 | 0.6 | 0.3 | 0 | 0 | 0 | 197 |
| Adrian Kempe | 0.0 | 0.1 | 0.8 | 0.1 | 0 | 0 | 0 | 161 |
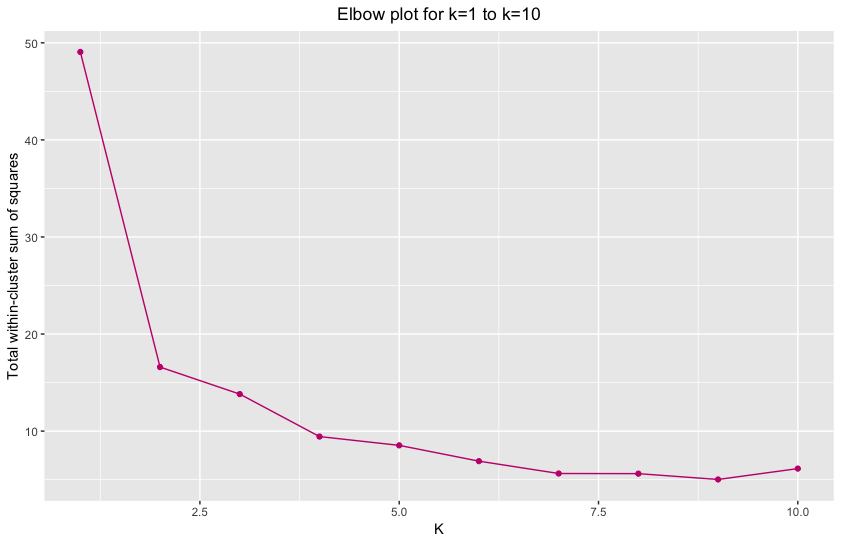
I wasn’t sure how many clusters would be appropriate, so I ran k-means for 1:10 clusters and constructed an elbow plot - looking at this, the best number of clusters seemed to be 3 or 4. I chose 3 - when I tried it with 4, there were 2 clusters which seemed to have virtually no difference between them, although I’d like to explore this a bit further.
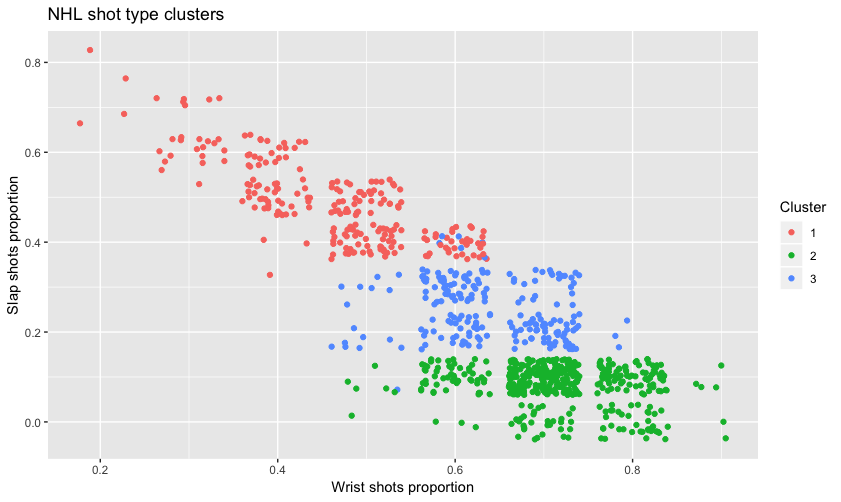
Cluster plots
You can see here the clusters mapped against wrist shots and slapshots (slapshots was where there seemed to be the biggest difference between players):
You can see a bit more in a plotly 3D plot, added in backhand shots here as the 3rd dimension here (also I just learned how to do these plots and I am in awe):
But I guess the interesting thing to note is the characteristics of each cluster. There clearly is a defensemen cluster and a forward cluster (and here is where I am wondering whether setting the shot total threshold will make a difference) - but there is also a third, somewhat mixed, cluster.
| cluster | defl | back | wrist | slap | snap | tip | wrap |
|---|---|---|---|---|---|---|---|
| 1 | 0.000000 | 1.560694 | 45.80925 | 49.132948 | 0 | 0 | 0 |
| 2 | 2.927928 | 13.693694 | 71.39640 | 8.393393 | 0 | 0 | 0 |
| 3 | 1.157270 | 8.367952 | 63.56083 | 24.480712 | 0 | 0 | 0 |
| cluster | D | C | L | R |
|---|---|---|---|---|
| 1 | 96.5317919 | 2.312139 | 0.00000 | 1.156069 |
| 2 | 0.4504505 | 50.600601 | 25.82583 | 23.123123 |
| 3 | 32.3442136 | 29.080119 | 18.69436 | 19.881306 |
The two tables above show the percentage of different types of shots within each cluster, and the percentage of types of player within each cluster.
Cluster 1:
Cluster 1 has 96% defensemen. These players take a pretty even amount of wrist and slapshots (46% and 49% respectively) and a tiny percentage of backhand shots. 7 forwards make it into this group as well:
Top 10 players (by shot totals) in Cluster 1:
| shooterName | defl | back | wrist | slap | snap | tip | wrap | tot | cluster |
|---|---|---|---|---|---|---|---|---|---|
| Brent Burns | 0 | 0.0 | 0.5 | 0.4 | 0 | 0 | 0 | 1349 | 1 |
| Roman Josi | 0 | 0.1 | 0.5 | 0.4 | 0 | 0 | 0 | 1019 | 1 |
| Erik Karlsson | 0 | 0.0 | 0.5 | 0.5 | 0 | 0 | 0 | 938 | 1 |
| Dustin Byfuglien | 0 | 0.0 | 0.4 | 0.5 | 0 | 0 | 0 | 920 | 1 |
| Victor Hedman | 0 | 0.0 | 0.5 | 0.5 | 0 | 0 | 0 | 884 | 1 |
| John Carlson | 0 | 0.0 | 0.5 | 0.5 | 0 | 0 | 0 | 876 | 1 |
| Colton Parayko | 0 | 0.0 | 0.5 | 0.5 | 0 | 0 | 0 | 817 | 1 |
| P.K. Subban | 0 | 0.0 | 0.3 | 0.6 | 0 | 0 | 0 | 798 | 1 |
| Torey Krug | 0 | 0.0 | 0.5 | 0.4 | 0 | 0 | 0 | 796 | 1 |
| Drew Doughty | 0 | 0.0 | 0.4 | 0.6 | 0 | 0 | 0 | 776 | 1 |
The 7 forwards in Cluster 1:
| shooterName | defl | back | wrist | slap | snap | tip | wrap | tot | cluster |
|---|---|---|---|---|---|---|---|---|---|
| Steven Stamkos | 0 | 0.1 | 0.5 | 0.4 | 0 | 0 | 0 | 600 | 1 |
| Jason Pominville | 0 | 0.1 | 0.5 | 0.4 | 0 | 0 | 0 | 598 | 1 |
| Brandon Pirri | 0 | 0.0 | 0.5 | 0.4 | 0 | 0 | 0 | 282 | 1 |
| Derek MacKenzie | 0 | 0.1 | 0.4 | 0.4 | 0 | 0 | 0 | 281 | 1 |
| Martin Frk | 0 | 0.0 | 0.3 | 0.7 | 0 | 0 | 0 | 128 | 1 |
| Vinni Lettieri | 0 | 0.1 | 0.4 | 0.4 | 0 | 0 | 0 | 41 | 1 |
| Dave Bolland | 0 | 0.2 | 0.4 | 0.3 | 0 | 0 | 0 | 38 | 1 |
Cluster 2:
Cluster 2 is the forwards cluster - only 2 defensemen end up here, Ben Harpur and Stefan Elliott, but they both have under 60 total shots so I’m not sure that their presence in this cluster is wildly important. 71% of the shots taken in this group are wrist shots, with small-ish numbers of any other type - backhand shots do account for 13% though.
Top 10 players (by shot totals) in Cluster 2:
| shooterName | defl | back | wrist | slap | snap | tip | wrap | tot | cluster |
|---|---|---|---|---|---|---|---|---|---|
| Vladimir Tarasenko | 0 | 0.1 | 0.9 | 0.1 | 0 | 0 | 0 | 1189 | 2 |
| Patrick Kane | 0 | 0.1 | 0.7 | 0.1 | 0 | 0 | 0 | 1029 | 2 |
| Filip Forsberg | 0 | 0.1 | 0.8 | 0.1 | 0 | 0 | 0 | 987 | 2 |
| Nathan MacKinnon | 0 | 0.1 | 0.7 | 0.1 | 0 | 0 | 0 | 933 | 2 |
| James Neal | 0 | 0.1 | 0.8 | 0.1 | 0 | 0 | 0 | 921 | 2 |
| Max Pacioretty | 0 | 0.1 | 0.8 | 0.1 | 0 | 0 | 0 | 905 | 2 |
| Sidney Crosby | 0 | 0.2 | 0.7 | 0.1 | 0 | 0 | 0 | 902 | 2 |
| Evander Kane | 0 | 0.1 | 0.8 | 0.1 | 0 | 0 | 0 | 897 | 2 |
| Phil Kessel | 0 | 0.1 | 0.9 | 0.1 | 0 | 0 | 0 | 879 | 2 |
| Jack Eichel | 0 | 0.1 | 0.7 | 0.1 | 0 | 0 | 0 | 819 | 2 |
Cluster 3:
So this is an interesting cluster. It’s relatively evenly split between forwards and defensemen, and with 64% wrist shots and 25% slapshots. Looks like this cluster is made up of D-men with fewer slapshots than average, and forwards with more slapshots than average.
Top 10 players (by shot totals) in Cluster 3:
| shooterName | defl | back | wrist | slap | snap | tip | wrap | tot | cluster |
|---|---|---|---|---|---|---|---|---|---|
| Alex Ovechkin | 0.0 | 0.1 | 0.6 | 0.4 | 0 | 0 | 0 | 1480 | 3 |
| Tyler Seguin | 0.0 | 0.1 | 0.6 | 0.3 | 0 | 0 | 0 | 1003 | 3 |
| Nikita Kucherov | 0.0 | 0.1 | 0.6 | 0.3 | 0 | 0 | 0 | 958 | 3 |
| Blake Wheeler | 0.1 | 0.1 | 0.7 | 0.2 | 0 | 0 | 0 | 953 | 3 |
| Joe Pavelski | 0.1 | 0.1 | 0.5 | 0.2 | 0 | 0 | 0 | 890 | 3 |
| Viktor Arvidsson | 0.0 | 0.1 | 0.6 | 0.3 | 0 | 0 | 0 | 864 | 3 |
| Artemi Panarin | 0.0 | 0.1 | 0.7 | 0.3 | 0 | 0 | 0 | 819 | 3 |
| Mike Hoffman | 0.0 | 0.1 | 0.6 | 0.3 | 0 | 0 | 0 | 819 | 3 |
| Dougie Hamilton | 0.0 | 0.0 | 0.7 | 0.3 | 0 | 0 | 0 | 812 | 3 |
| Jeff Skinner | 0.0 | 0.2 | 0.5 | 0.2 | 0 | 0 | 0 | 792 | 3 |
Top 10 forwards (by shot totals) in Cluster 3:
| shooterName | defl | back | wrist | slap | snap | tip | wrap | tot | cluster |
|---|---|---|---|---|---|---|---|---|---|
| Alex Ovechkin | 0.0 | 0.1 | 0.6 | 0.4 | 0 | 0 | 0 | 1480 | 3 |
| Tyler Seguin | 0.0 | 0.1 | 0.6 | 0.3 | 0 | 0 | 0 | 1003 | 3 |
| Nikita Kucherov | 0.0 | 0.1 | 0.6 | 0.3 | 0 | 0 | 0 | 958 | 3 |
| Blake Wheeler | 0.1 | 0.1 | 0.7 | 0.2 | 0 | 0 | 0 | 953 | 3 |
| Joe Pavelski | 0.1 | 0.1 | 0.5 | 0.2 | 0 | 0 | 0 | 890 | 3 |
| Viktor Arvidsson | 0.0 | 0.1 | 0.6 | 0.3 | 0 | 0 | 0 | 864 | 3 |
| Artemi Panarin | 0.0 | 0.1 | 0.7 | 0.3 | 0 | 0 | 0 | 819 | 3 |
| Mike Hoffman | 0.0 | 0.1 | 0.6 | 0.3 | 0 | 0 | 0 | 819 | 3 |
| Jeff Skinner | 0.0 | 0.2 | 0.5 | 0.2 | 0 | 0 | 0 | 792 | 3 |
| Evgeni Malkin | 0.0 | 0.1 | 0.6 | 0.2 | 0 | 0 | 0 | 791 | 3 |
Top 10 defensemen (by shot totals) in Cluster 3:
| shooterName | defl | back | wrist | slap | snap | tip | wrap | tot | cluster |
|---|---|---|---|---|---|---|---|---|---|
| Dougie Hamilton | 0 | 0.0 | 0.7 | 0.3 | 0 | 0 | 0 | 812 | 3 |
| Oliver Ekman-Larsson | 0 | 0.0 | 0.7 | 0.3 | 0 | 0 | 0 | 759 | 3 |
| Mark Giordano | 0 | 0.0 | 0.7 | 0.3 | 0 | 0 | 0 | 744 | 3 |
| Kris Letang | 0 | 0.1 | 0.6 | 0.4 | 0 | 0 | 0 | 726 | 3 |
| John Klingberg | 0 | 0.1 | 0.7 | 0.3 | 0 | 0 | 0 | 657 | 3 |
| Marc-Edouard Vlasic | 0 | 0.0 | 0.6 | 0.3 | 0 | 0 | 0 | 634 | 3 |
| Ryan Suter | 0 | 0.0 | 0.7 | 0.3 | 0 | 0 | 0 | 620 | 3 |
| Kevin Shattenkirk | 0 | 0.0 | 0.6 | 0.3 | 0 | 0 | 0 | 608 | 3 |
| Alexander Edler | 0 | 0.0 | 0.7 | 0.3 | 0 | 0 | 0 | 549 | 3 |
| Morgan Rielly | 0 | 0.0 | 0.8 | 0.2 | 0 | 0 | 0 | 541 | 3 |
Conclusions and next steps:
This was a pretty quick look at clustering players based on shot types. It doesn’t take into acount usage, different teams, different years, or anything more complicated than proportion of shot types for each player.
However, it does show that like in the charts that Sean created, there’s a distinct difference between the shots that forwards and defensemen take.
This could be an interesting starting point to look at further clustering questions:
Have players moved cluster during their time in the NHL - or do clusters themselves change profile?
If a player has moved team, or changed coach, does this have any impact on their shooting profile and their comparable players?
How does this fit in with other types of player analysis?
I’m excited to look more in depth at this - I think my first step is going to be to raise the shot total threshold and see what difference that makes - I will likely write a part 2 to this post if it shows anything interesting.
This was my first attempt at working with NHL data and if anyone has any constructive criticism or suggestions I’d be grateful to hear them!
The full code can be found on my github profile: em-ee